
It is well known that climate change will have a significant impact on building design and energy use.
It is also known within the building science and architectural communities that the current weather files used for thermal modelling of buildings only represent average weather rather than heatwaves or cold snaps.
As was shown by the 14,000 deaths in Paris during the 2003 heatwave, this is a highly serious issue and there is the need to ensure future buildings are designed to deal with future weather, or extremes of current weather.
This repository presents highly localised current and future weather data developed at the University of Bath for the United Kingdom (via the COLBE project) and for India (via the ZED-I project). Learn more about these projects at the bottom of this page.
There are various types of file available and each is described in the download area. The file format is that used by software in the construction industry, but as they are text files they can be also loaded into Excel etc.
Accessing the data for a location only requires a post code (or the latitude and longitude). The curious reader can simply view easy to read graphs of heatwaves for any location: every 5 km for the UK and every 25 km for India.
For our technical users, we do ask you to answer a few questions about your interest in using the files before you can download them.
Thank you for using our files.
Get startedThere is growing interest in how climate change will affect us. Most estimates point to a 2 to 4°C increase in mean annual temperature averaged over the planet this century. To many people, this increase seems modest, however expressing the expected change in this way fails to relay the true impact. For example, 5°C is the mean temperature difference between London and Nice in the South of France or between Bangalore and Chennai in India, so we are clearly heading for great changes in the flora and fauna around us and can expect to see new forms of architecture becoming common. In addition, the warming will not be identical across the globe, but greater over land (rather than the sea) and much greater in some locations than others. Most importantly though, statements about climate are about long-term averages and often for a whole country or region, for example, the average winter temperature in southern England. However, people don't really experience or discuss the climate, but rather focus on the weather, i.e. the short term, for example the temperature over a week, day, or just now. And often with interest only to their locality. Many natural and human-made systems, such as buildings, also respond to, or are affected by the local weather, and the growing number of simulations of the way such systems will be affected by climate change need statements not of the future climate, but of current and future local weather.
In 2003 more than 14,000 people died in a heatwave in Paris. Heat related deaths can be high even in cities accustomed to extreme heat, such as the 1,344 excess deaths attributed to the 2010 heatwave in Ahmedabad in India (a 43% increase from baseline). Such heatwaves are predicted to become more common as the atmosphere warms, indicating that ensuring that buildings and systems have been tested with future weather is an important strategy in reducing mortality and morbidity.
The projects this website links to are attempts to provide scientists, engineers, the media and the public with information about local future weather. By entering a post code (UK only) or latitude and longitude, you can download various computer files, each of which contain a year of possible local weather, now or in the future. At the moment the UK is covered (at a resolution of 5 km by 5 km) and India (at 25 km by 25 km), and hope the research community will consider adding other places.
The future of the UK's weather
The following figures show how the weather might change over the coming years, and the impact this might have on one aspect of society: the energy used in keep homes warm in winter. Each map was prepared using data from this website. The maps and the underlying data were created by Dr Chunde Liu.
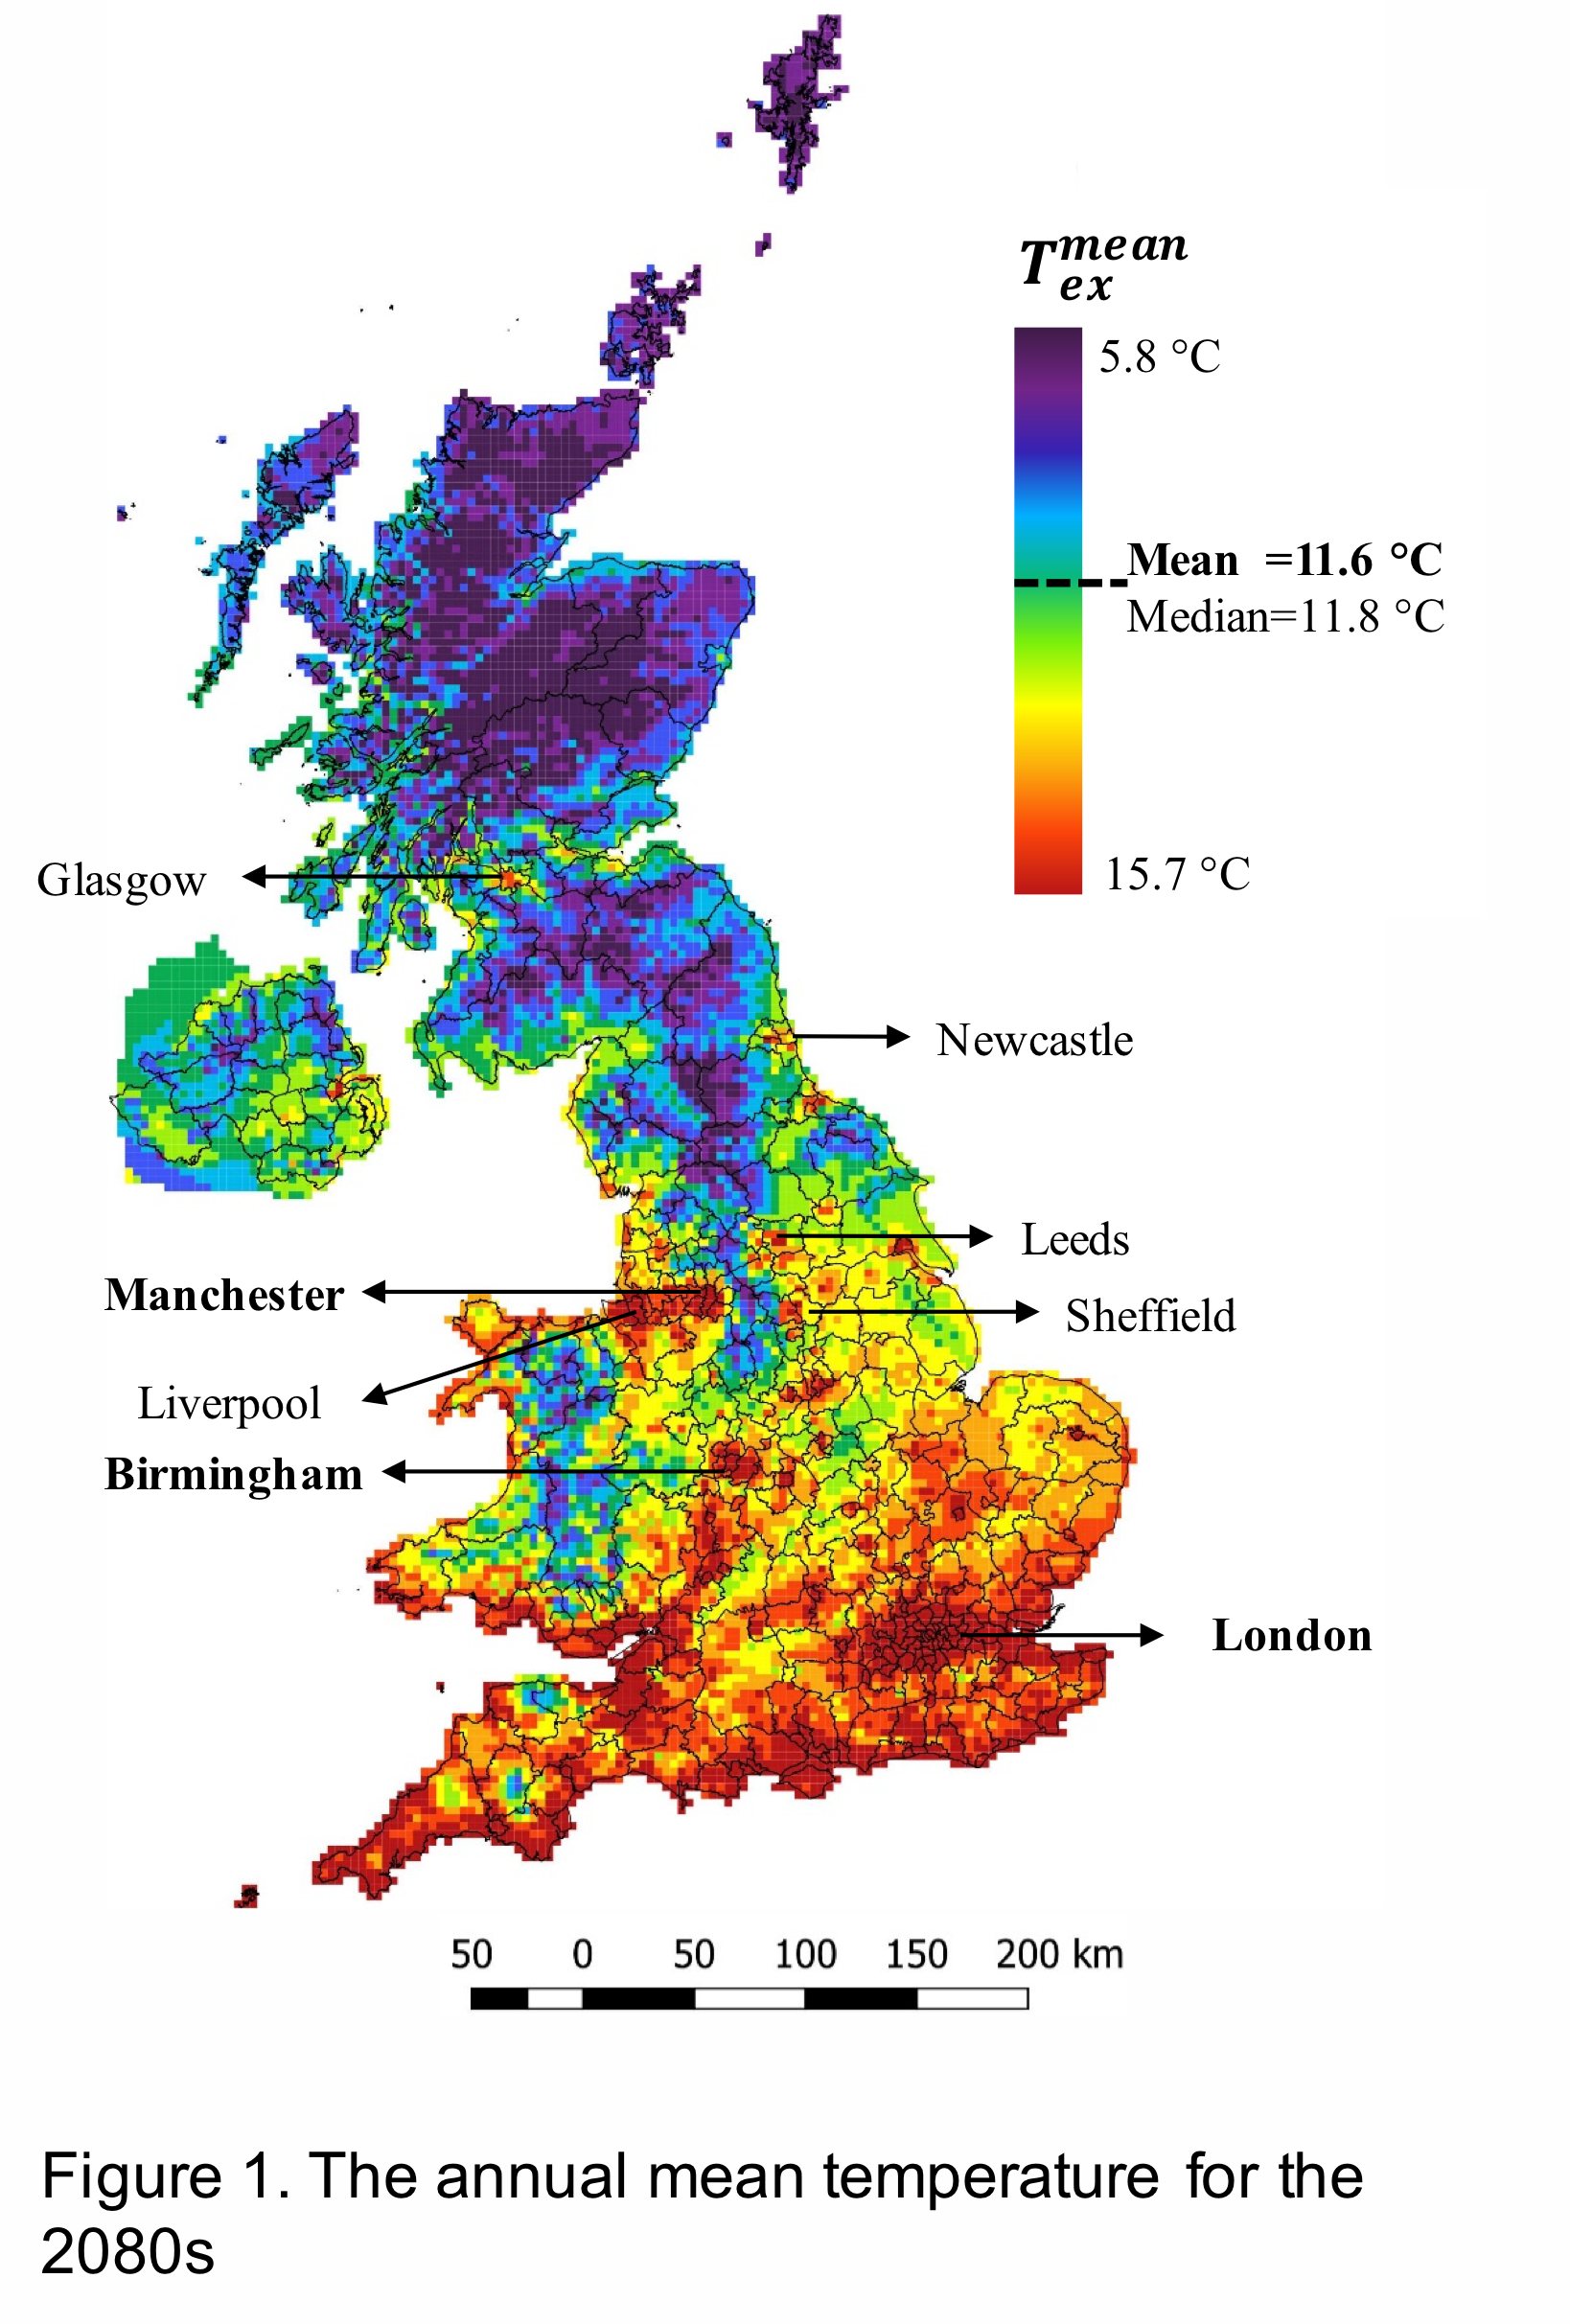
This map shows just how local the UK's climate is. It shows the annual mean temperature by 2080. Note how cities are clearly visible. Although useful in showing the general situation, such annual averages mean little to people, and are do not allow the study of the stress that climate change will place on people, buildings and other aspects of society.
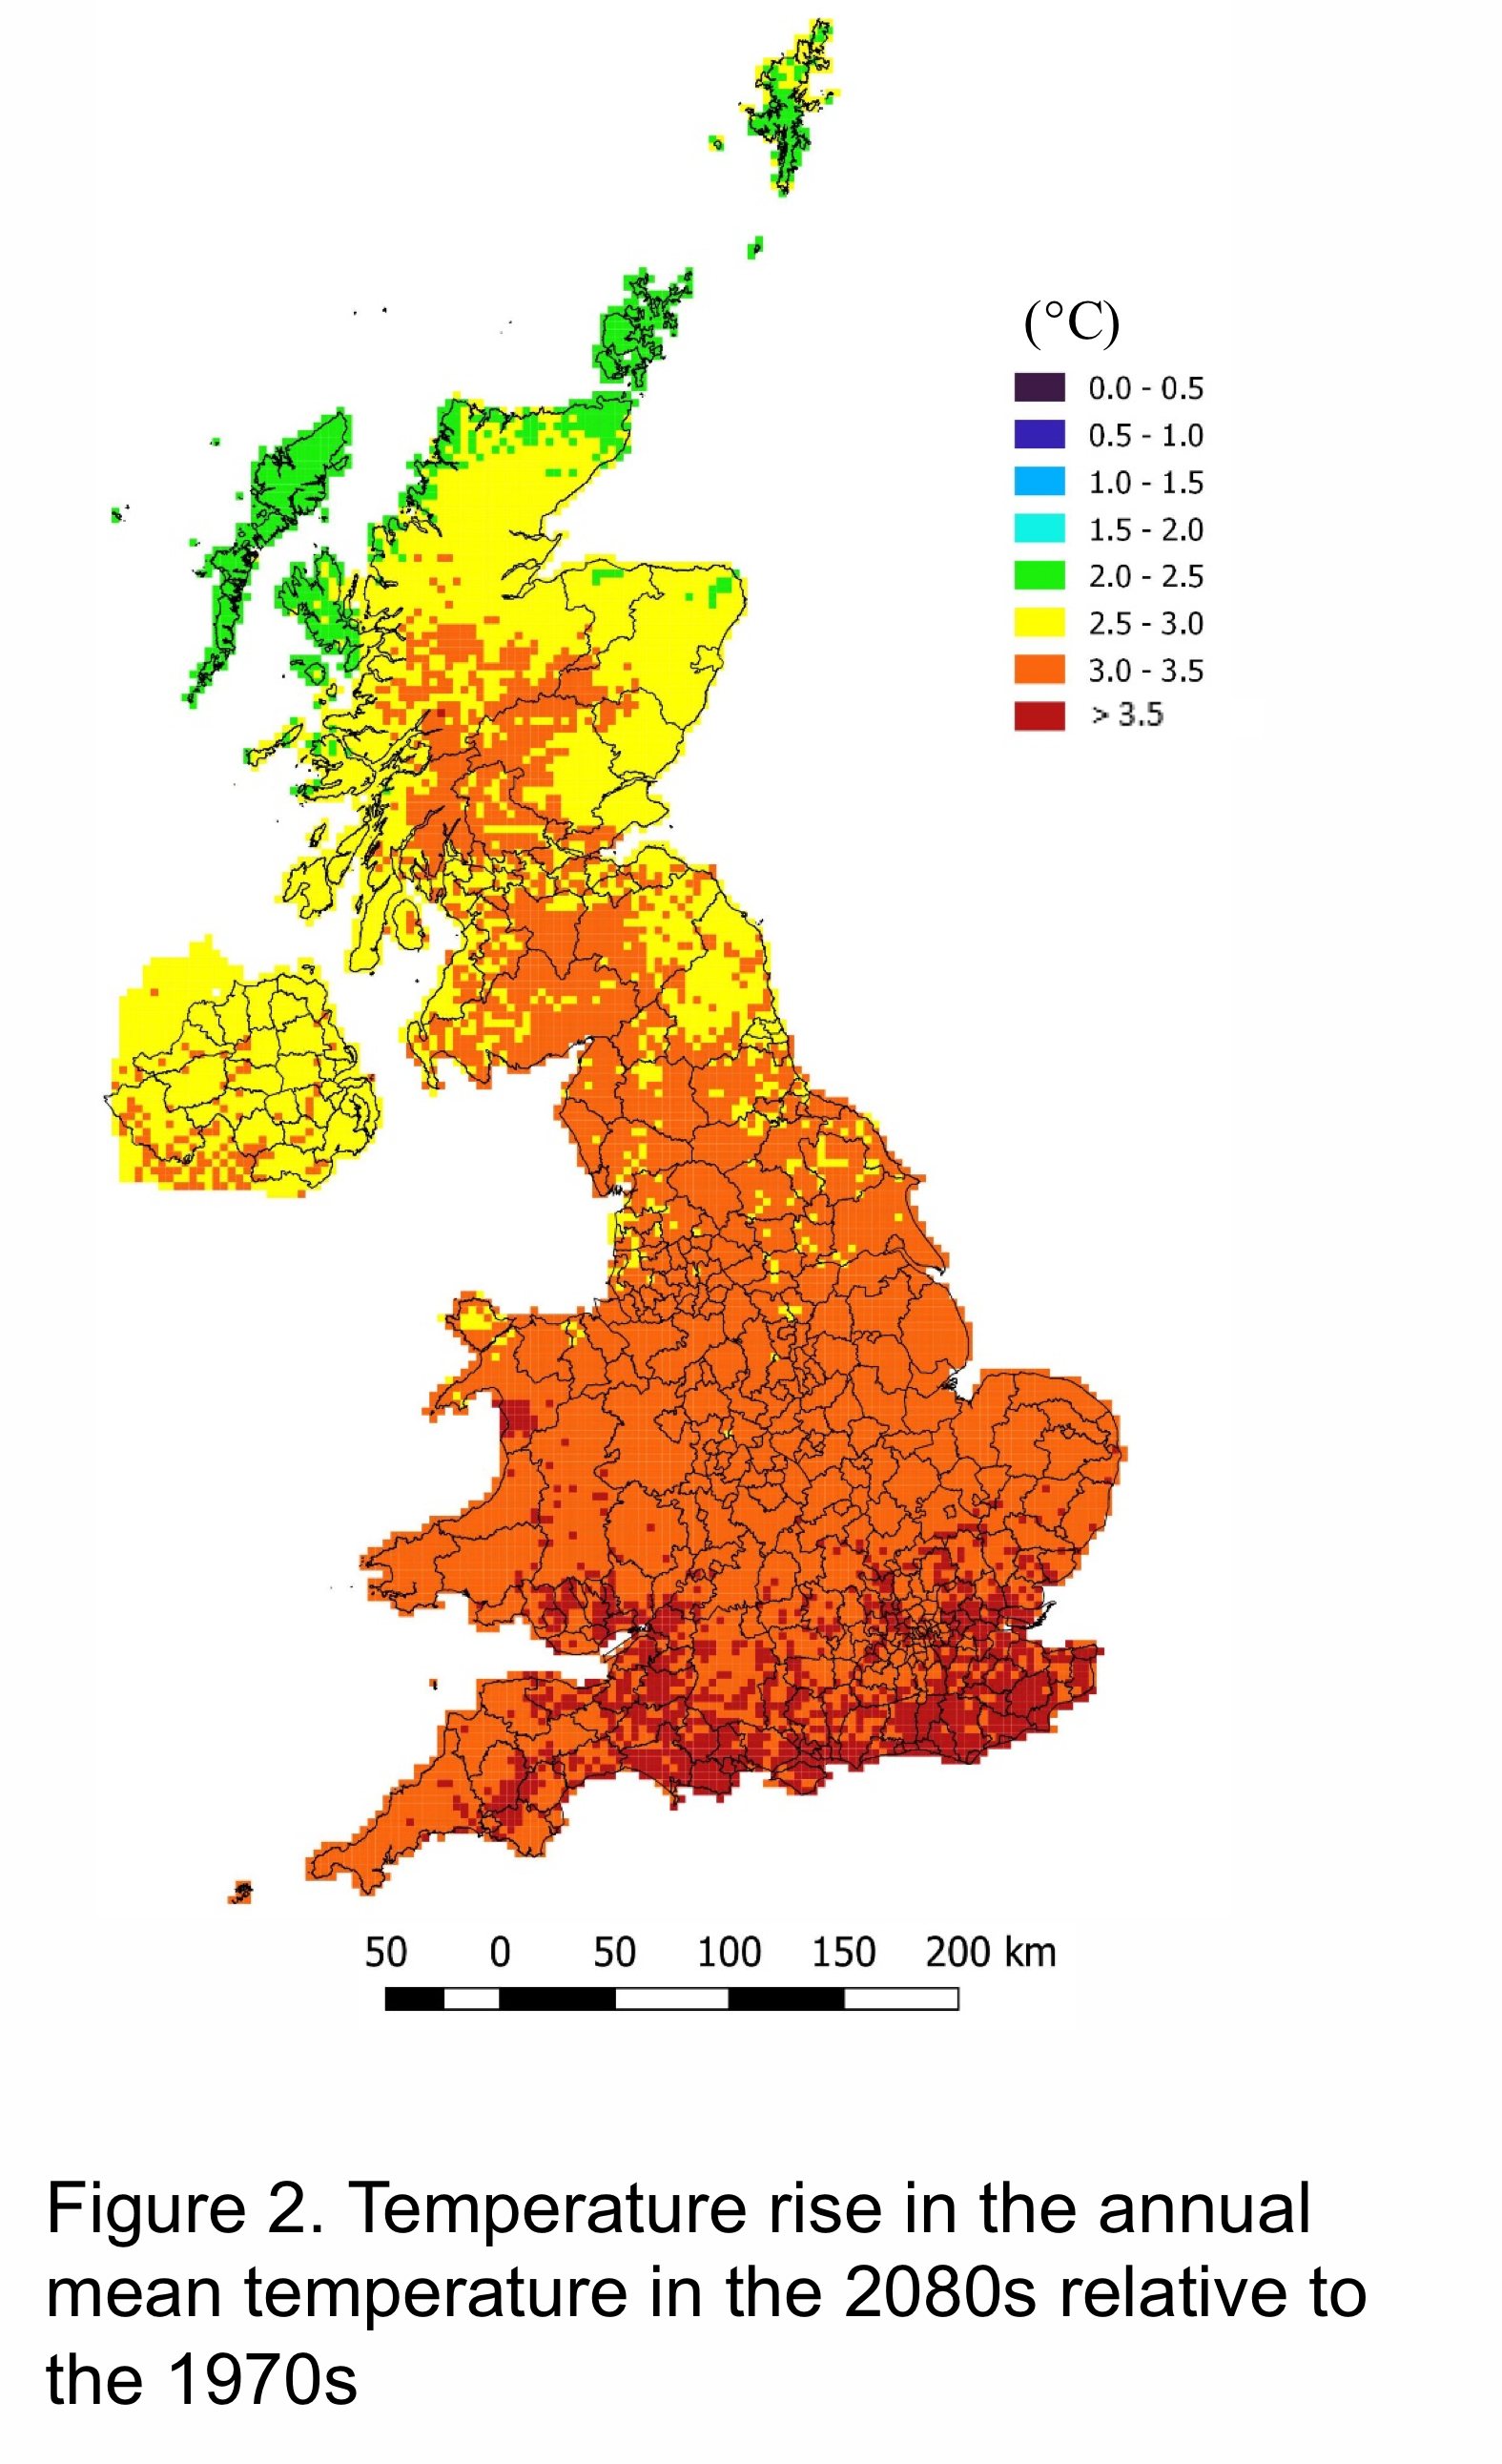
The typical increase in mean summertime temperature in the UK by 2080. Again, although useful for showing that even in a small country like the UK the warming will not be identical across the country, such a map fails to show the scale of the predicted change in the weather that will be experienced.
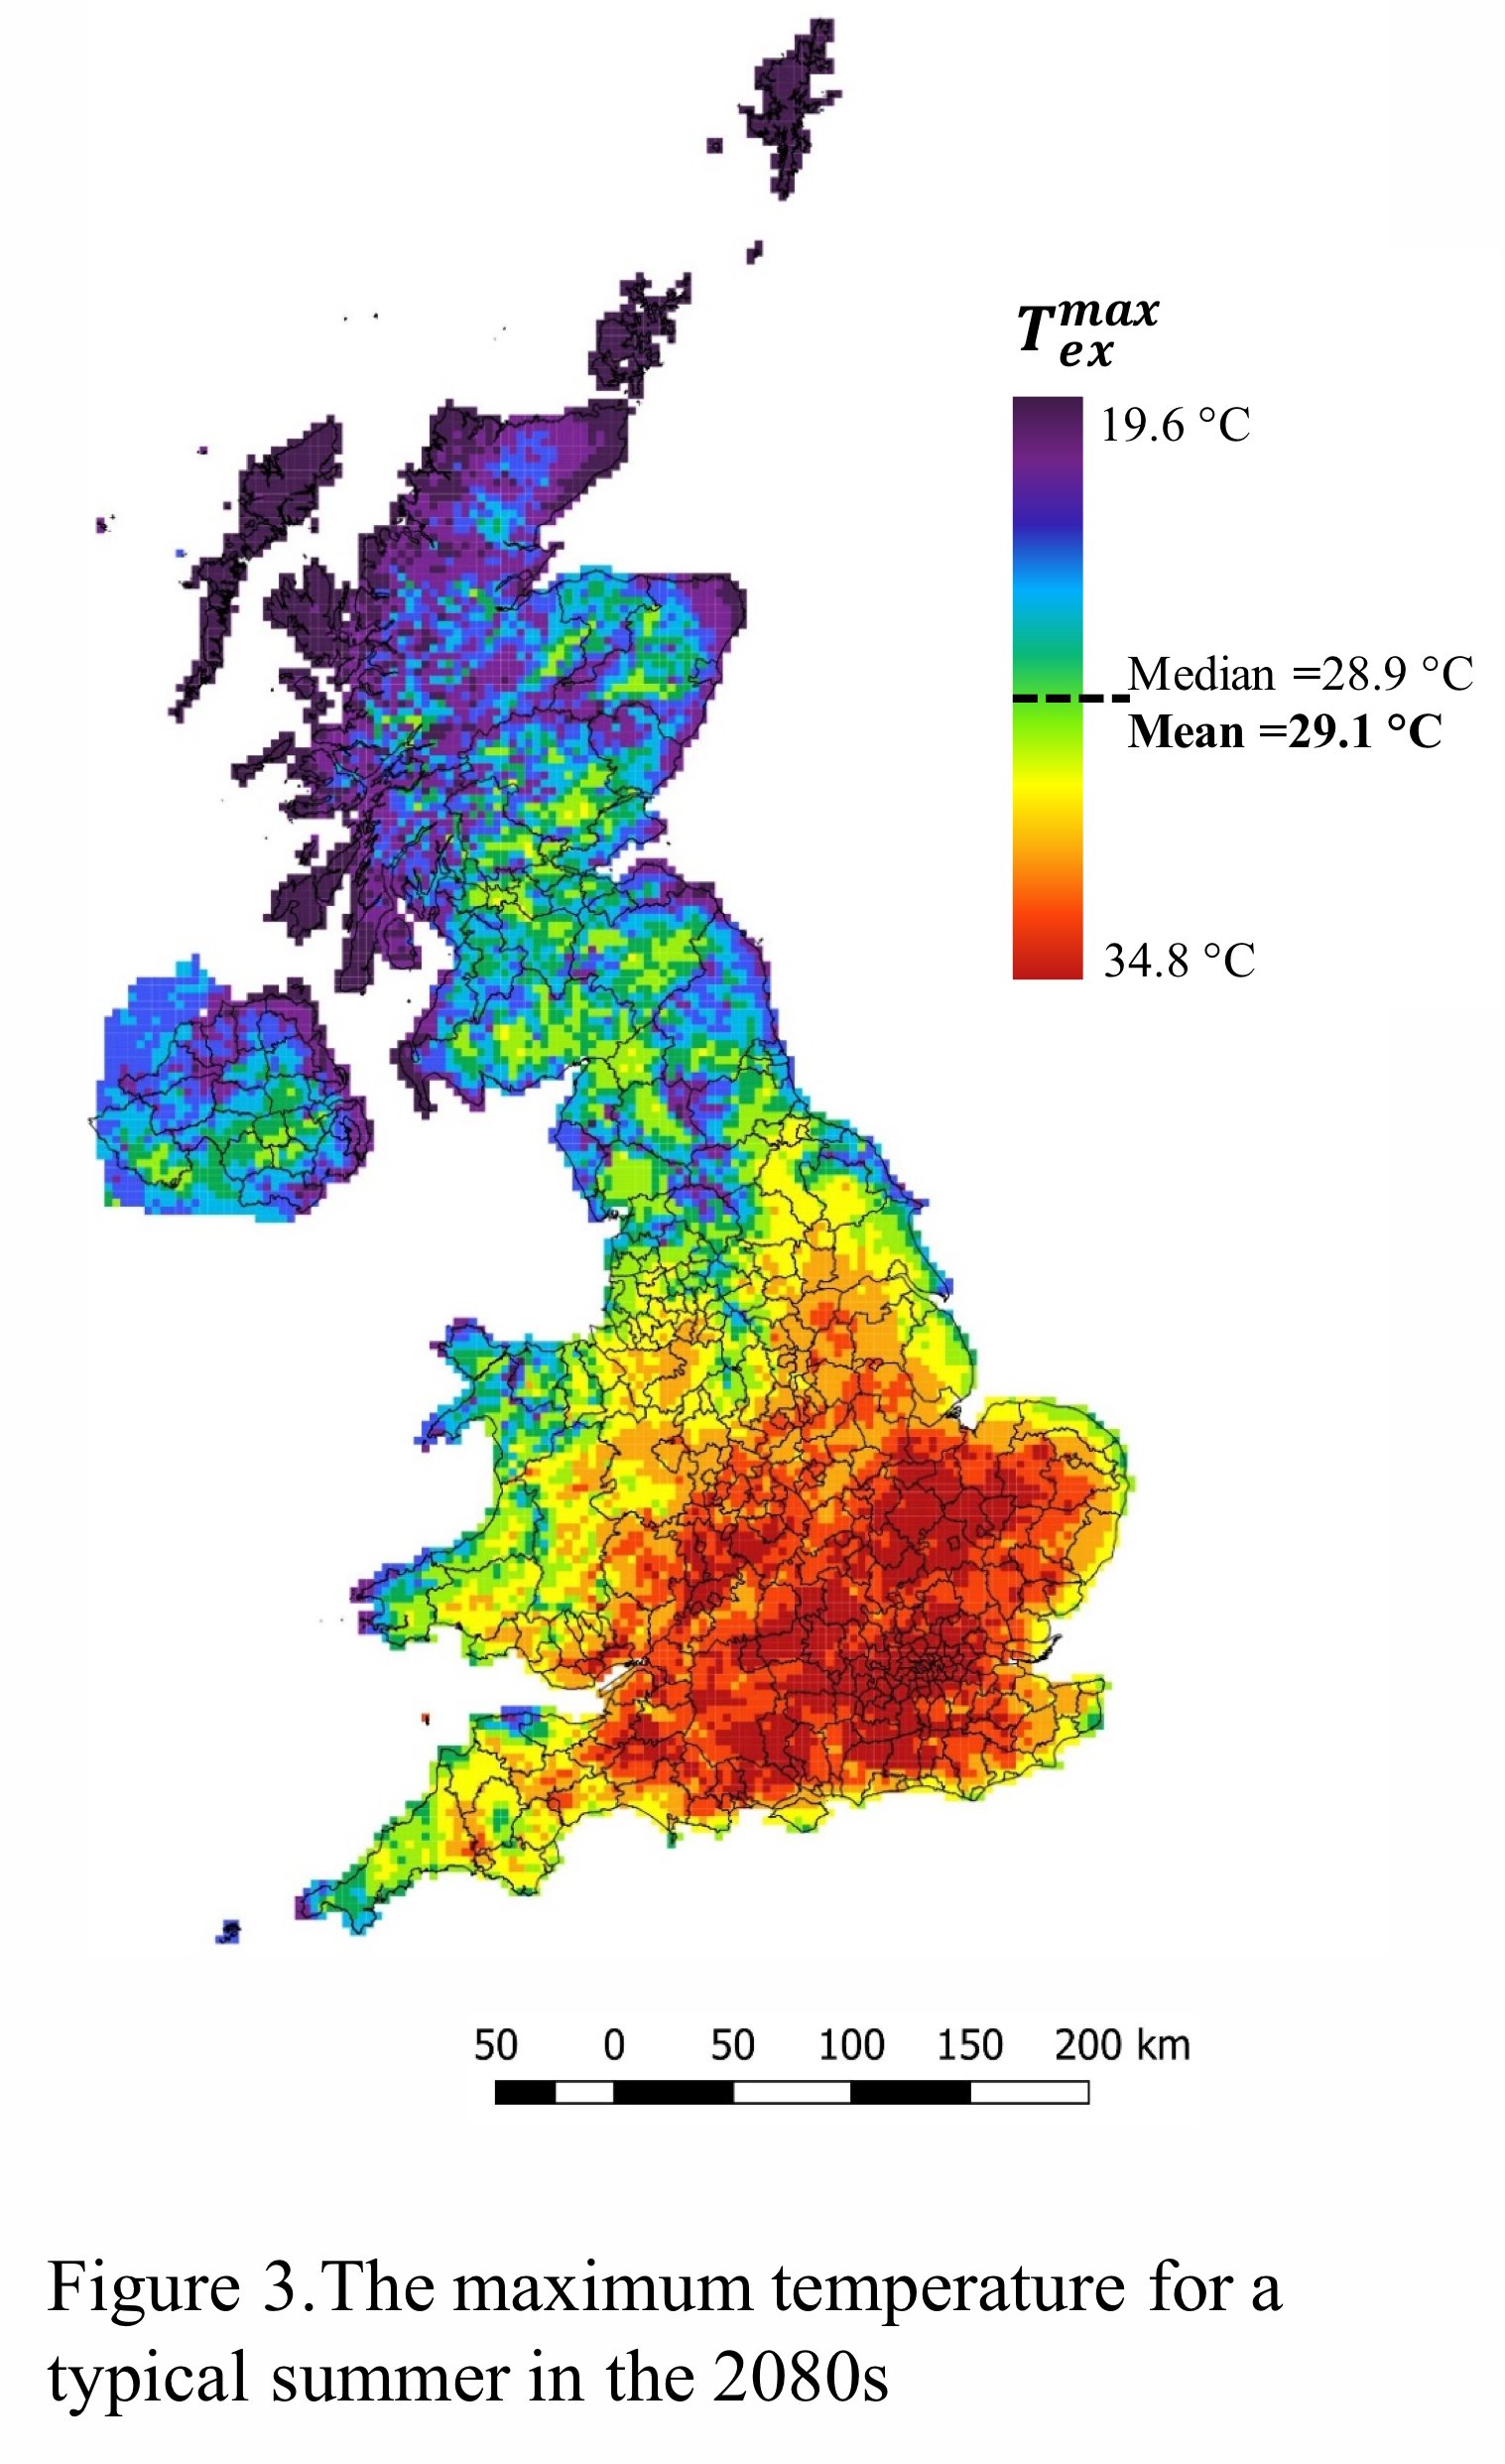
Here we see the expected maximum summer's day temperatures for a typical summer in the 2080's. These are the highest temperatures for a typical, not extreme, summer.
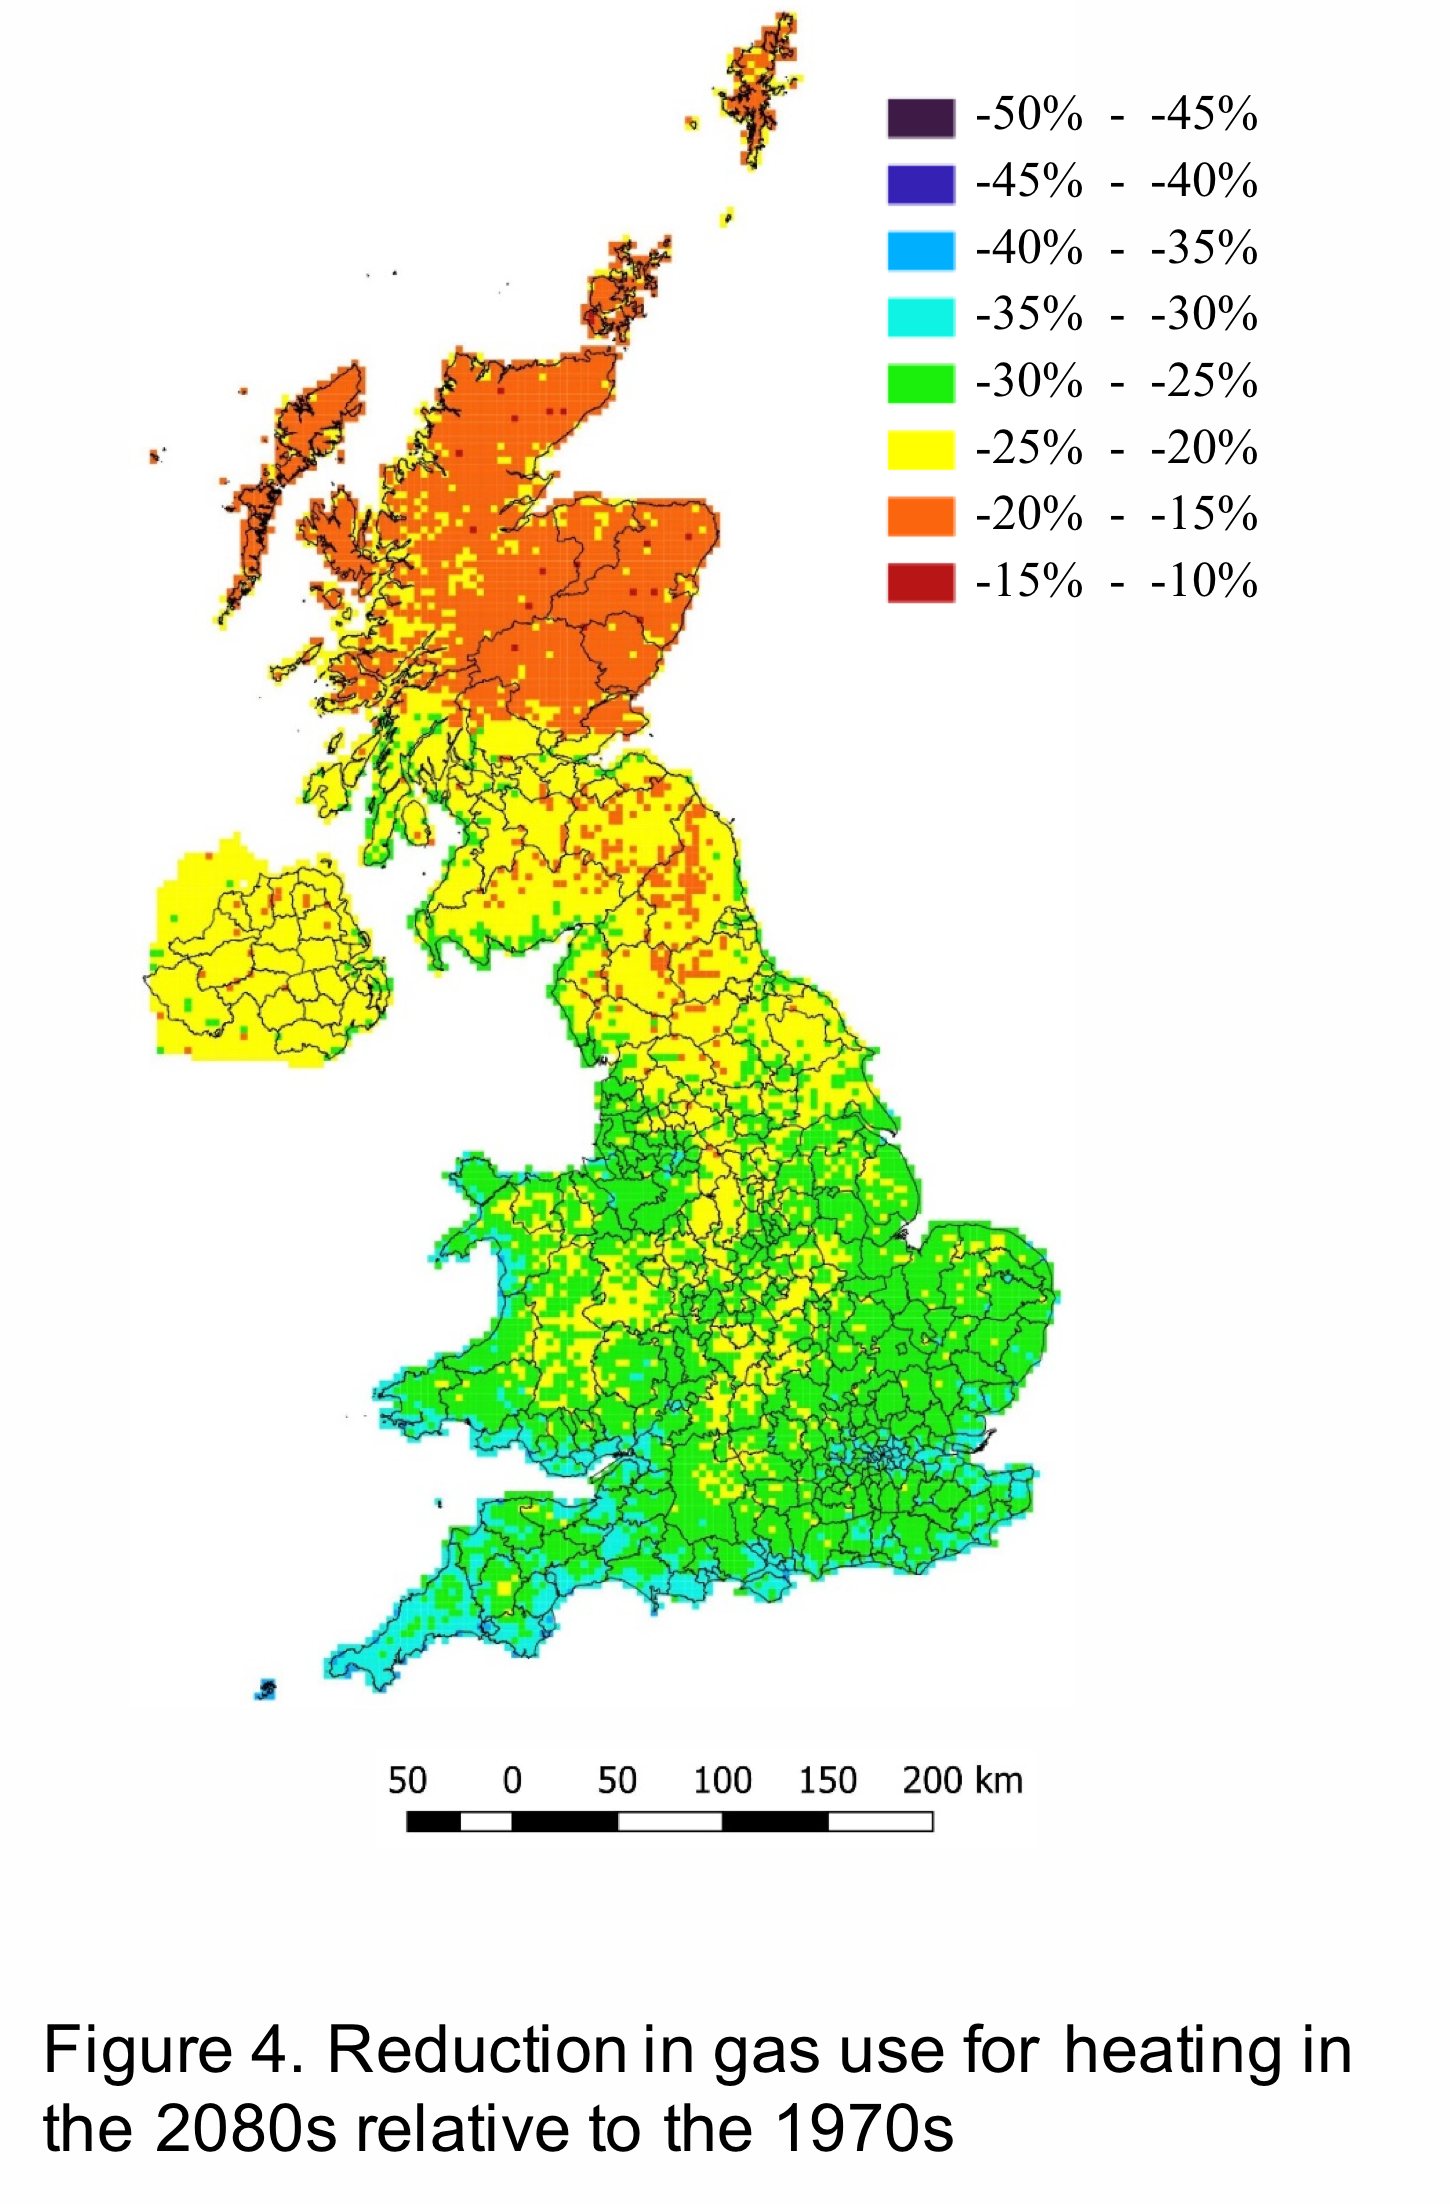
The data on this website can be used to help run various simulations of the future. We see the percentage reduction in gas used for heating a house by 2080. Such knowledge will be useful in setting energy policy or estimating the change in carbon emissions from the country.
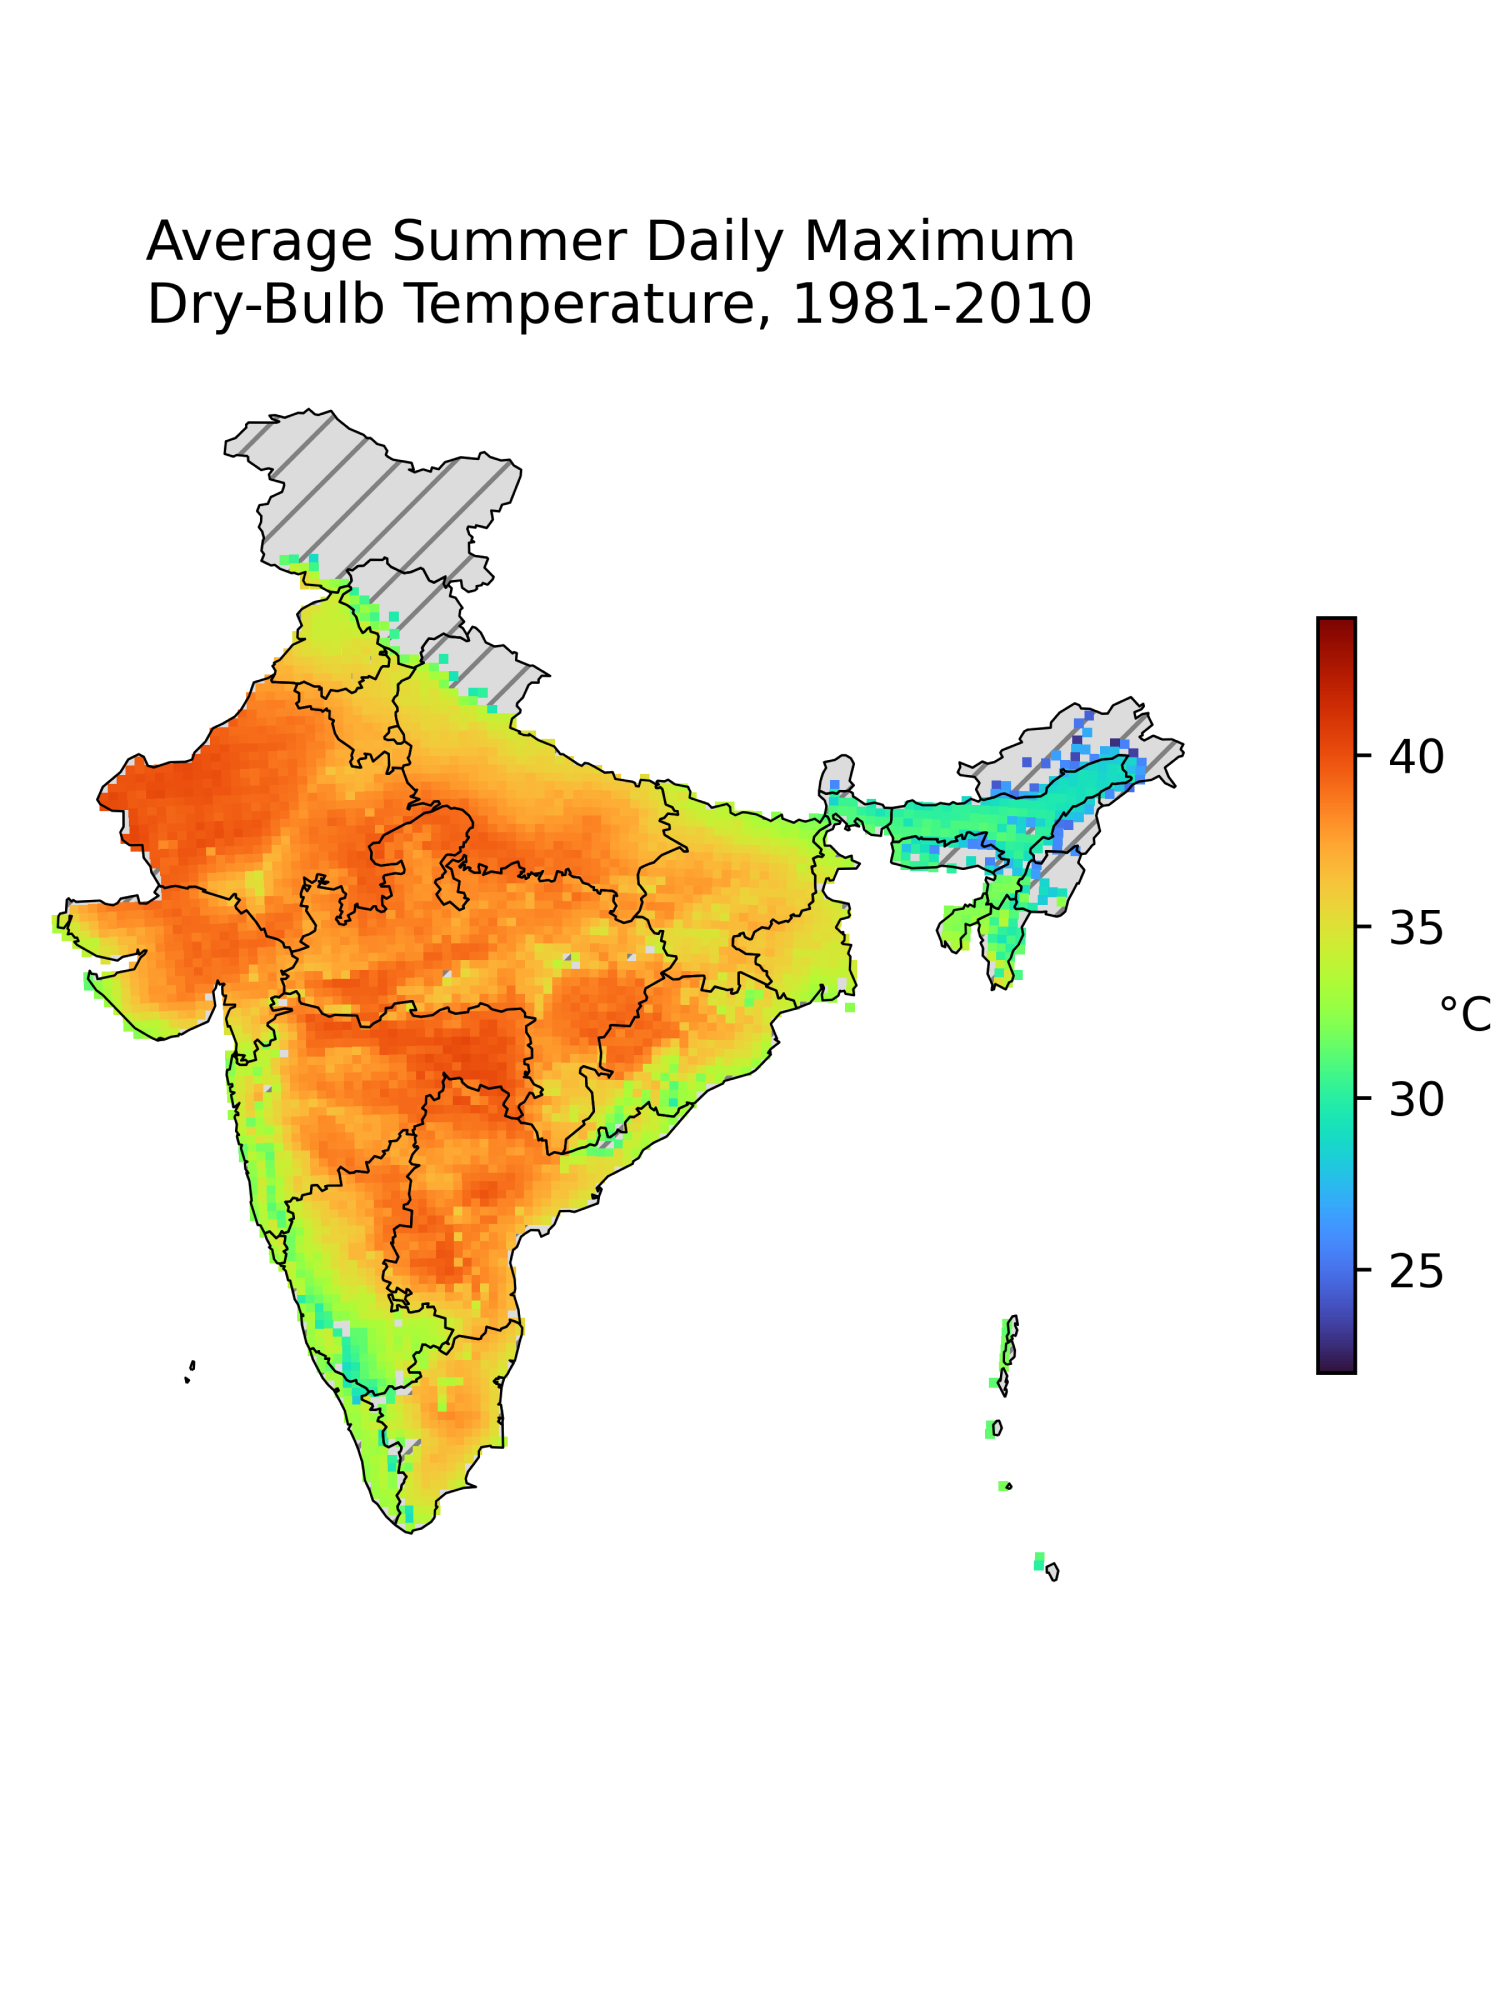
Like the UK, this map of India showing the means of summer daily maxima in the 1990s illustrates the power of localization through the use of fine spatial resolution data at 25 km resolution.
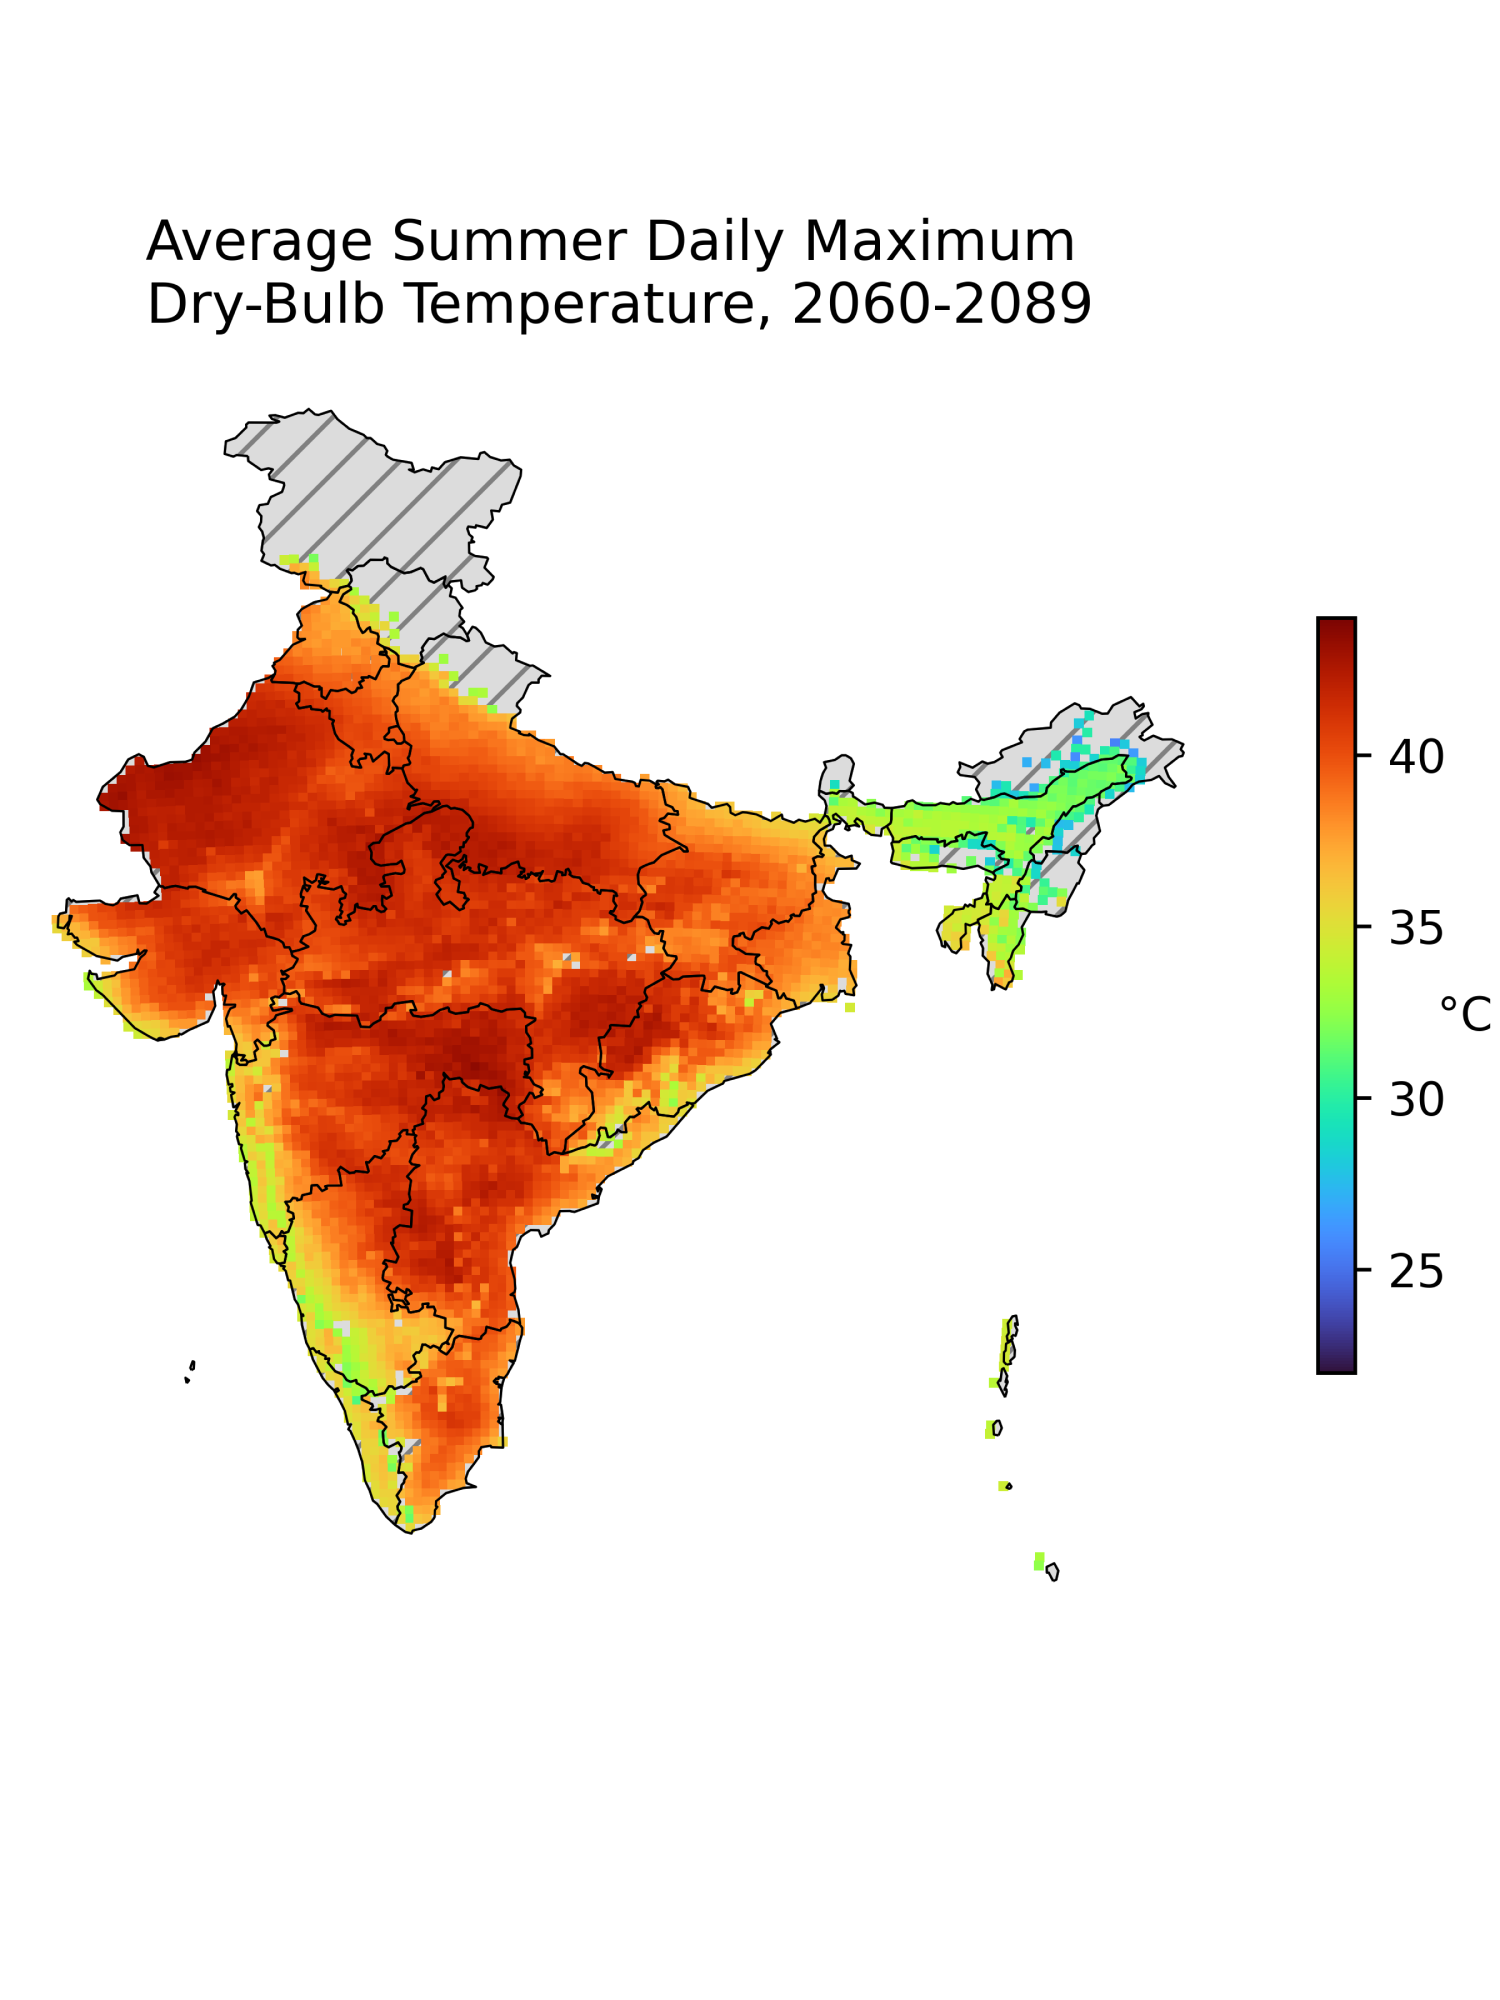
That the 2080s will be dramatically hotter than the 1990s is clear here. Note, again, these are average temperatures and that peaks will be considerably higher. The free data on this website allow examination of both typical and extreme situations.
The current weather files used by the construction industry and building scientists divide the UK into only 14 regions, with, for example, the whole of the South West peninsular (including up-land areas) being assigned the coastal Plymouth weather file. Similarly there are only 59 locations with weather files in India. This means that, for example, Rourkela must use the coastal file of Bhubaneswar despite being separated by 212 miles and a mountain range. It is known that this can easily lead to a 200% error in the estimation of annual energy demand. The scale of this error is such that it renders many of the dynamic simulations carried out by engineers questionable. This is unfortunate when simulation is used within the framework of the building regulations, but it is fatal when trying to use simulation to estimate how resilient a pre-existing building is, or the danger its vulnerable occupants might be in.
COLBE was funded by the Engineering and Physical Sciences Research Council (EPSRC, Grant Numbers: EP/M021890/1, EP/M022099/1 and EP/M019799/1) with the aim of providing a method that is capable of creating local weather from 2015 to 2080 covering the whole UK at a resolution of 5km, and to include within this files that represent various excursions from the mean: e.g. heatwaves and cold snaps.
ZED-i was funded by the Engineering and Physical Sciences Research Council (EPSRC, Grant Number: EP/R008612/1) and India's Department of Science and Technology (DT) under the Newton Fund. A key aim of ZED-i was to provide current and future weather files, for both average and extreme weather for all of India at the unprecedented resolution of 25km.
Should you have any queries about either project please contact Prof David Coley, Dr Chunde Liu, or Dr Sukumar Natarājan.
This project is supplied by the following academic and industry partners
© University of Bath 2024


Should you have any queries about either project, please contact: Prof David Coley, Dr Chunde Liu, or Prof Sukumār Natarājan.